| RheoChart
RheoChart is a charting program to analyse the behaviour of a large range of differential viscoelastic models. In a few clicks, the response of models such as the Giesekus, PTT or the DCPP models can be analysed in a dynamic chart. RheoChart also helps to determine the parameters of a model by fitting the model response to experimental data. The parameters calibration procedure is greatly simplified if not completely automatic. |

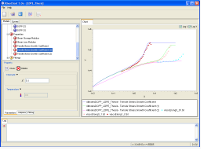 DCPP multi-mode model: main panel |
||
|
Features
1) Rheological Modelling
RheoChart has the unique capability to fit model predictions against experimental data. This procedure sometimes referred as parameters calibration can be very tedious to accomplish manually. RheoChart can greatly simplify this procedure. All parameters of a model (Generalised Newtonian models or Multi-mode differential viscoelastic models) can be estimated using several optimisation algorithm. These parameters can be bound by upper and/or lower-limits or left to vary freely. Alternatively, parameters can be fixed. Every material functions available in RheoChart can be used to curve fit experimental data. A fitting procedure can use one or more experimental curves simultaneously. A weight can be associated with each experimental curve.
|
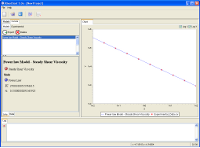 Power Law model: curves panel 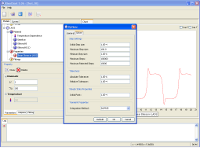 General Settings Dialog 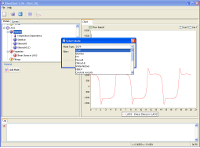 Adding a mode dialog 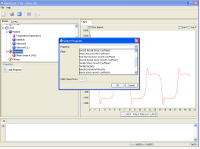 Adding a property dialog |
||
|
|||